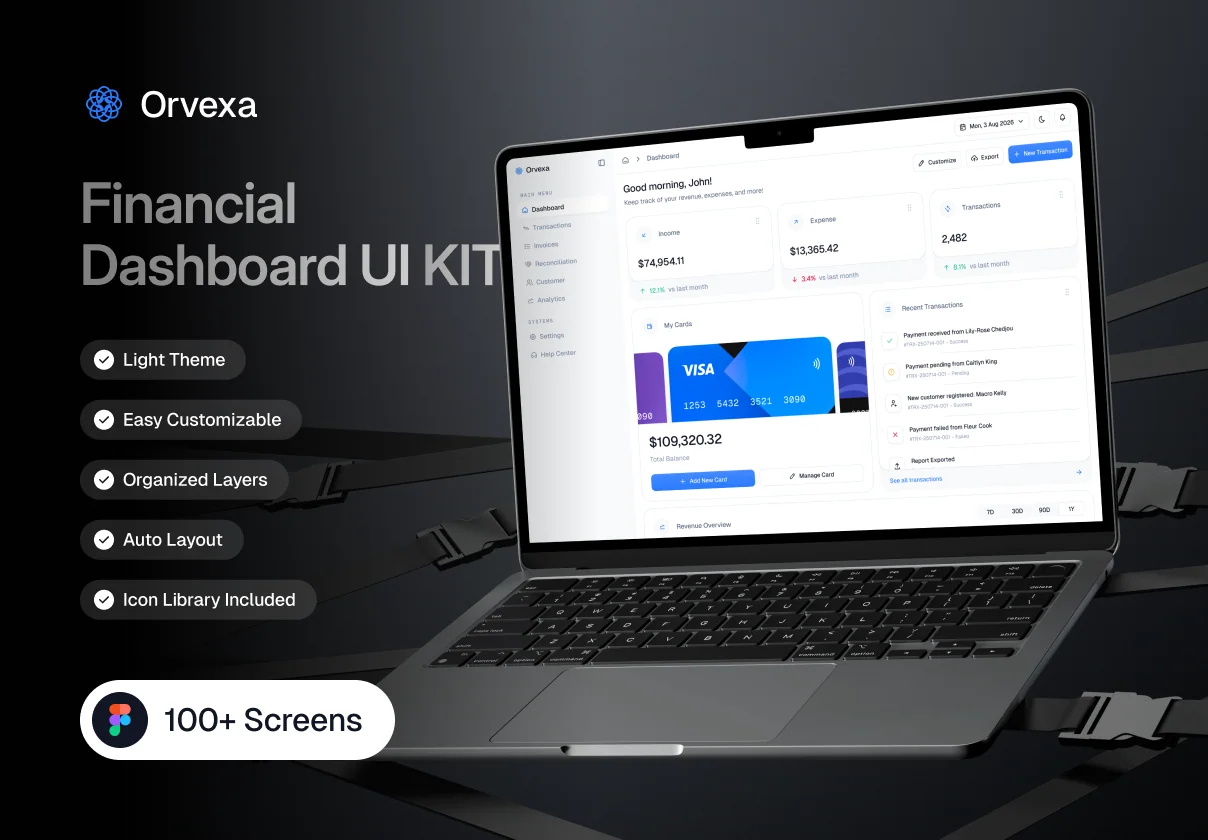
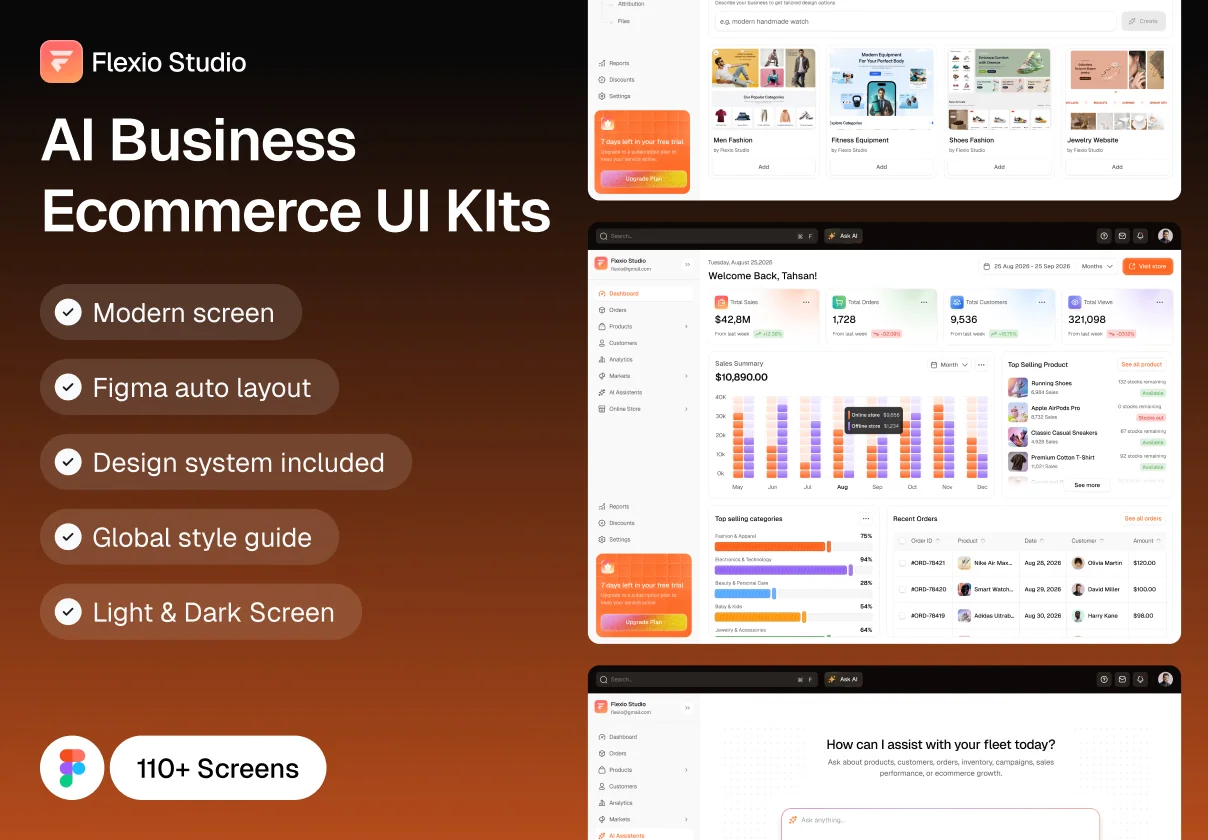
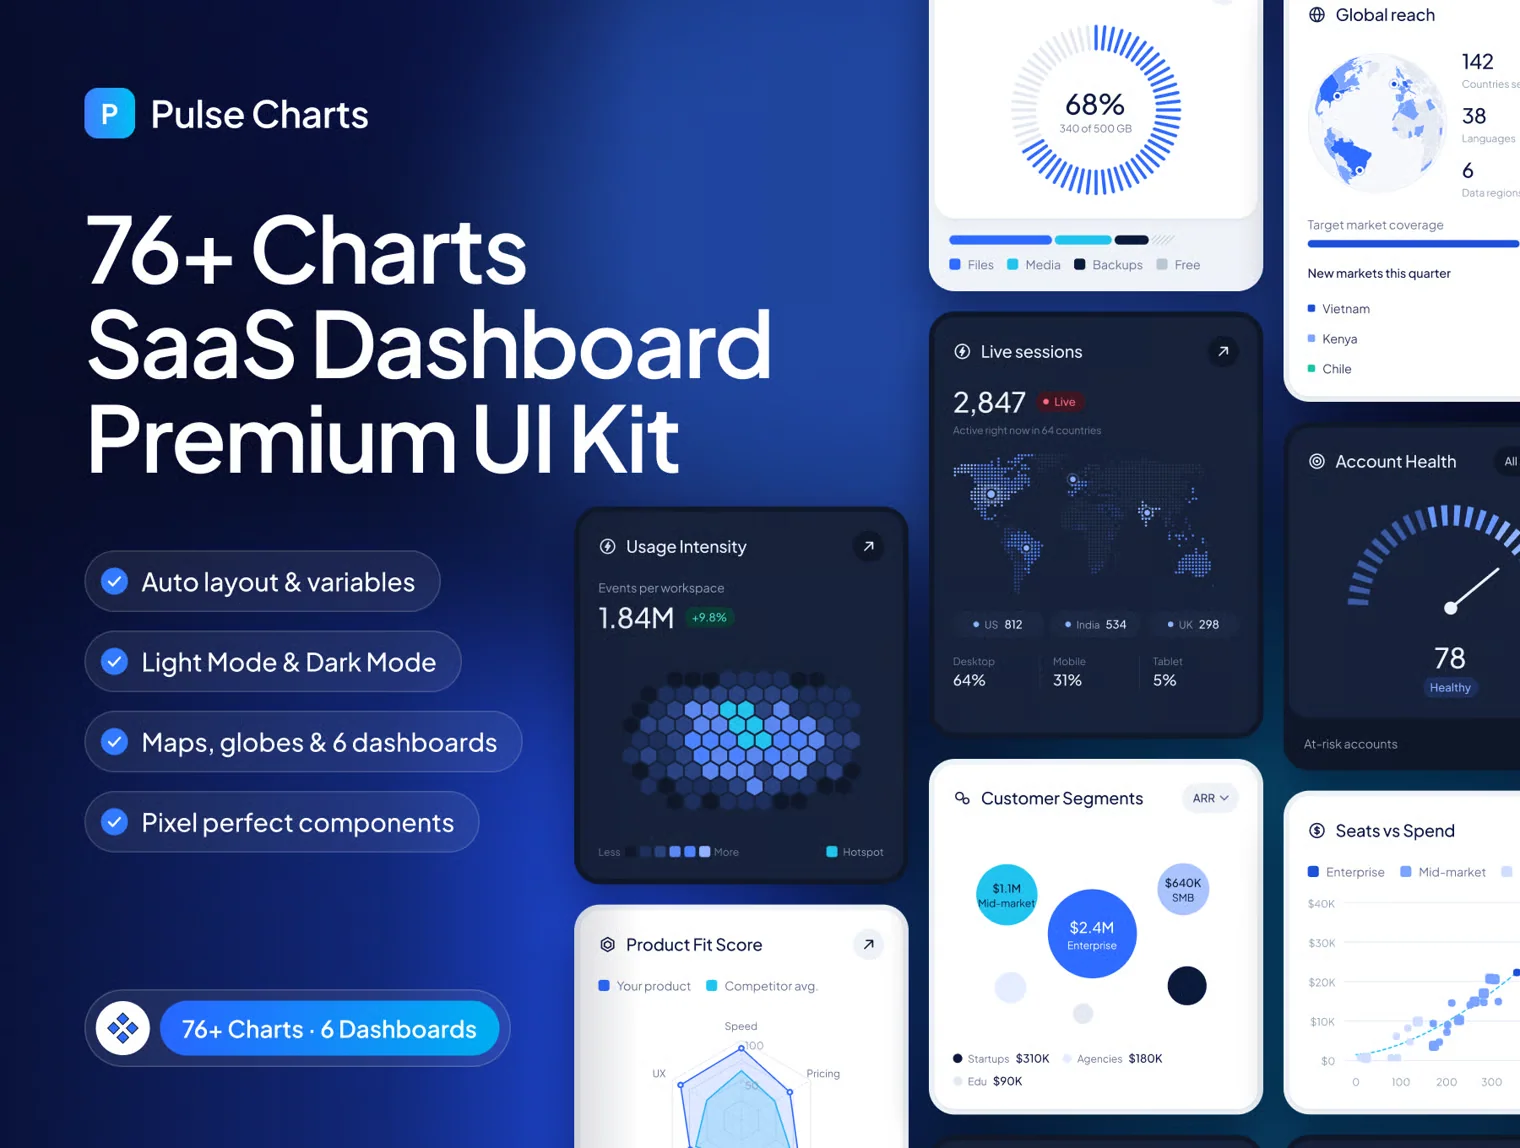
Pulse Charts — SaaS Dashboard & Chart UI Kit
76+ polished chart components, world maps, and 6 ready-to-use dashboards
Get any file from UI8
All downloaded files are stored in your personal Telegram bot
Release date18/10/2026
AuthorKapibaras
TypeUI kits
Highlights
One-click Light and Dark themes driven by Figma variables
Auto layout throughout for smooth, clean card resizing
Global blue, cyan, and teal color tokens for effortless rebranding
Editable component properties for labels, icons, counts, and states without detaching
Get any file from UI8
All downloaded files are stored in your personal Telegram bot
Release date18/10/2026
AuthorKapibaras
TypeUI kits
Highlights
One-click Light and Dark themes driven by Figma variables
Auto layout throughout for smooth, clean card resizing
Global blue, cyan, and teal color tokens for effortless rebranding
Editable component properties for labels, icons, counts, and states without detaching
Overview
Pulse Charts is a Figma data-visualization kit for SaaS, admin panels and analytics products. It includes editable KPI cards, sparklines, cohort tables, funnels, heatmaps, financial charts, gauges and maps with real country geometry, including regional, world, US and 3D-style globe maps. Variables enable instant light/dark themes, while auto layout and named layers support handoff. Compatible with Figma 5.0.
UI kits
Explore more than 5.000 exclusive kits for your next project